Studio for Eclipse: Using the Call Stack during Debugging
Introduction
This document explains how to use the call stack information displayed by Studio for Eclipse in the debug information view.
The ability to inspect a program's call stacks is one of the features of modern debuggers. Being able to
inspect the call stacks provides the programmer with the exact data on how the program got to its current
state. A call stack is a list of the functions or rules started that brought the program to the current
state. Functions can call other functions, and when they do they suspend, and execution control is
transferred to the called function. The same thing occurs when code in a rule calls a function. Rules and
functions can also be suspended by submitting an input source to be scanned or by using the parse continuation
operator '%c'. Call stacks are displayed top to bottom. The topmost entry is where the program started and
the bottom entry is the most recently started rule or function. Here are some examples of call stack entries:
            PROCESS, test023.xom : 24
            FUNCTION UPPERCASE-INTO, test023.xom : 23
            ELEMENT "B", man2html.xom : 405
A call stack line starts by identifying the type of code block you are in, be it function, process rule, element rule etc. This is followed by an identifier, function name or element rule name if applicable. This is followed by the name of the source file, a colon and the line number in the source file.
Using Call Stacks
The debug information view (in the top left corner in the default layout for the OmniMark Debug perspective) displays the OmniMark program's call stacks. The call stack display is divided into two parts: the active co-routine's call stack and all of the call stacks of the running co-routines. The active co-routine's call stack is always on top (see the A arrow in Figure 1). The display of all of the call stacks is always underneath (see the B arrow in Figure 1).
Figure 1
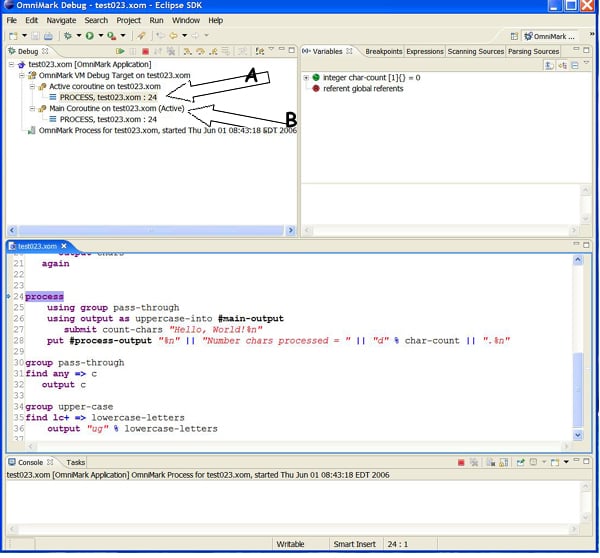
On line 27 of the program being debugged, (see the middle pane of Figure 1), #current-outputis
being bound to the function uppercase-into. Doing this creates the first co-routine.
Figure 2 shows the state when this happens. The active co-routine displays two items in the call stack: the
process rule and the function uppercase-into. The display for all of the co-routines has
also been updated to reflect the new state. Note how the process rule is marked as suspended and the
co-routine with the function uppercase-into is marked as being active. Below this
co-routine there is a string source co-routine marked suspended. This co-routine represents the
body of the "using output scope". In OmniMark, every string source co-routine has a string sink sibling
co-routine, and vice-versa.
Figure 2
The function uppercase-into uses a string source
function uppercase to do the actual uppercase transformation. Once this function has been
started the process rule is re-activated at line 27 and the program is about to start the second co-routine.
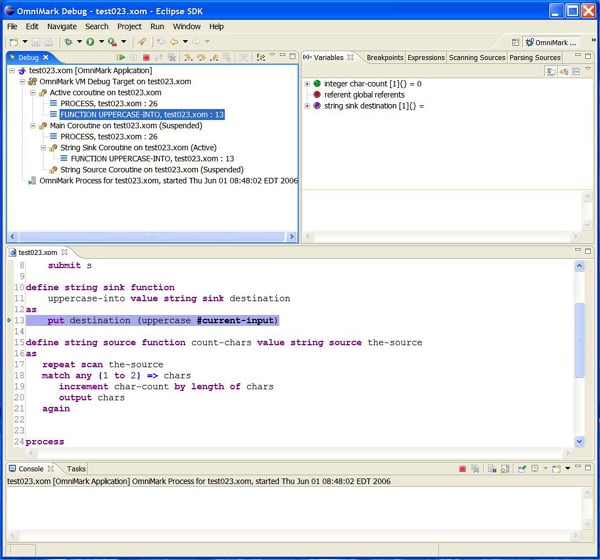
Figure 3 shows this state. Note how the suspended string sink co-routine has a call stack
containing two items.
Figure 3
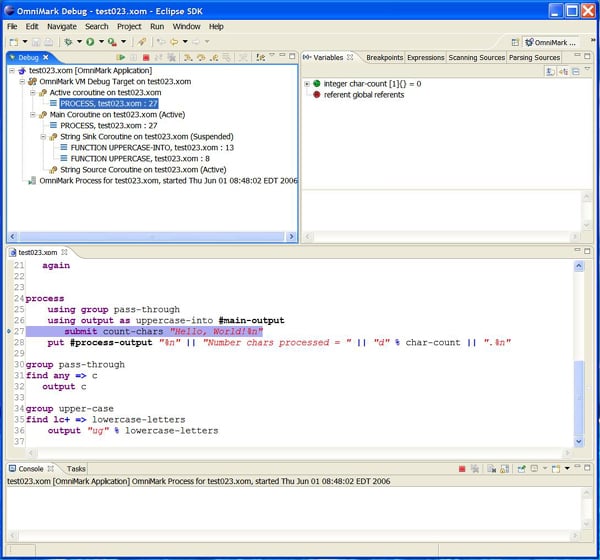
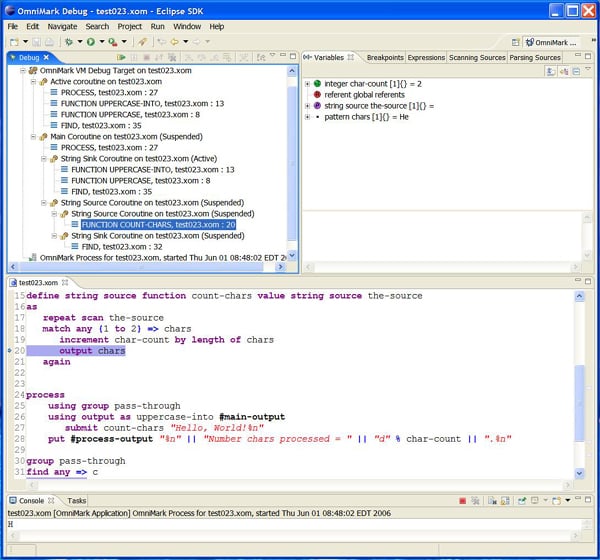
Figure 4 shows the state when the second co-routine, the function count-chars, is
started. When this starts the co-routine is shown to be nested underneath the string sink branch
in the part that displays all co-routines. This nesting shows the relationships between the co-routines.
Co-routines have defined relationships. Control transfers between them in a deterministic fashion. They are
not globally peers. The co-routine for function count-chars is not a peer to the
co-routine for the function uppercase-into. There is no way for these two co-routines to
communicate directly.
Figure 4
The third co-routine is the find rules that the submit action on line 27 (see Figure 4)
starts. Figure 5 shows the state of the world once this has started. This co-routine is the bottom one in
the display of all co-routines.
Figure 5
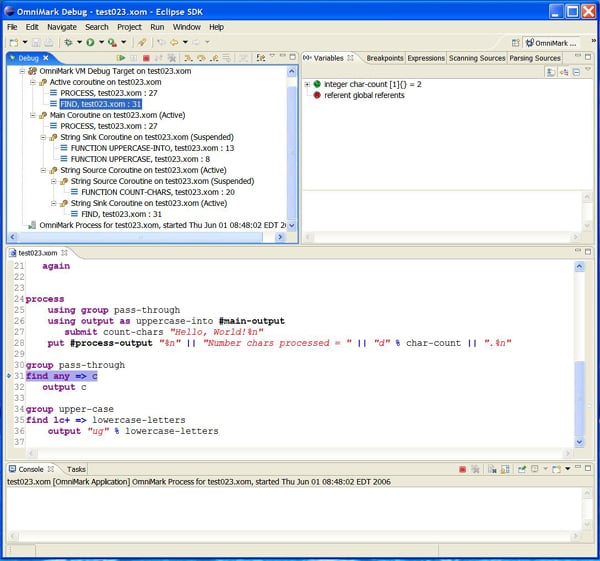
Figure 6 shows what happens when control is passed back to the first co-routine. The co-routines nested
under the string source are all marked as suspended and the string sink co-routine
is marked as active in the main co-routine display area. The active co-routine display shows
the find rule as the active code in the call stack. Before moving on, the call stack in the
active co-routine display area shows the process rule at the top. This is because this
co-routine was launched by the process rule.
Figure 6
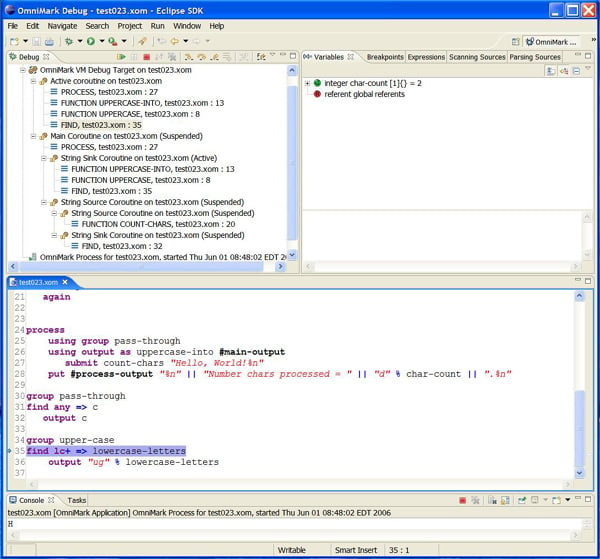
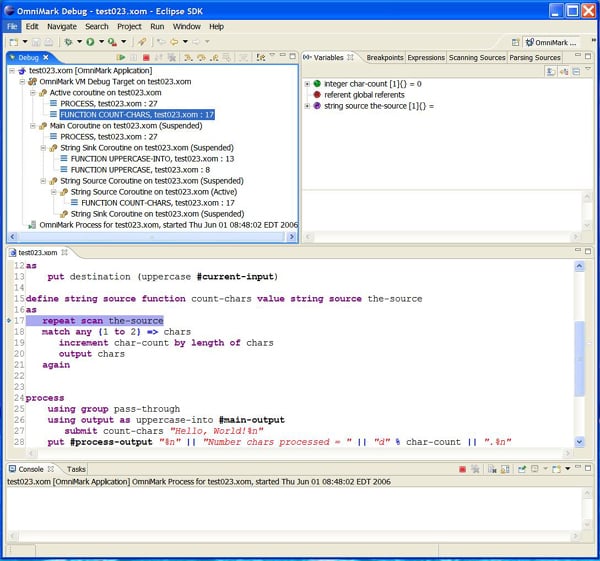
Figure 7 demonstrates the behavior when an item is selected in one of the call stacks. Selecting a call
stack item that is nested or in a suspended call stack changes what is being displayed in the variable view.
Before going into this in detail, please look back at the variable view in Figure 6. This view displays two
variables: the global integer char-count and the global referent
set. In Figure 7, the suspended function count-chars is highlighted, indicating that it
has been selected. The variable view now displays 2 additional items: the
parameter the-source and the pattern variable chars.
Finally, note as well that the debugging step controls, including terminate, are no longer active. The resume button is marked as being active. This is a defect in Eclipse. The continue/resume button is not active even though it is highlighted. To be able to use the debugger buttons you need to select a call stack line in the active call stack.
Figure 7
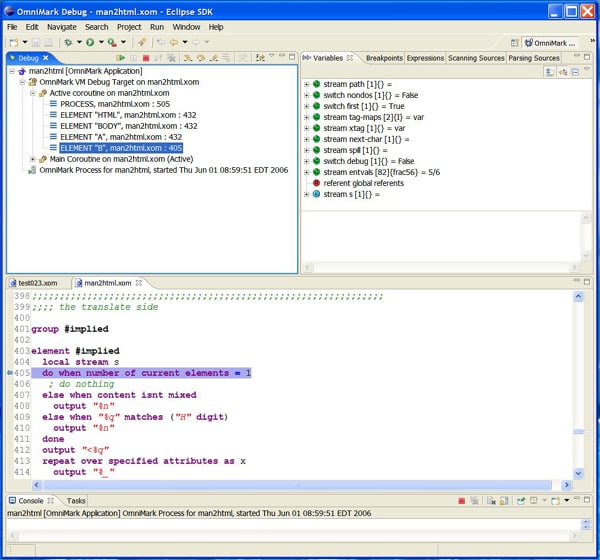
Element Rules in the Call Stack
Figure 8 shows the suspended state of the man2html program, which is included the samples directory. In this figure, you can see that the program is suspended in an element rule processing the element B, and that this element is nested within the processing of three other elements. You can of course select any of these suspended elements rules to observe their local contexts.
Figure 8